Understanding Rain Gauge Data Loggers for Accurate Weather Tracking
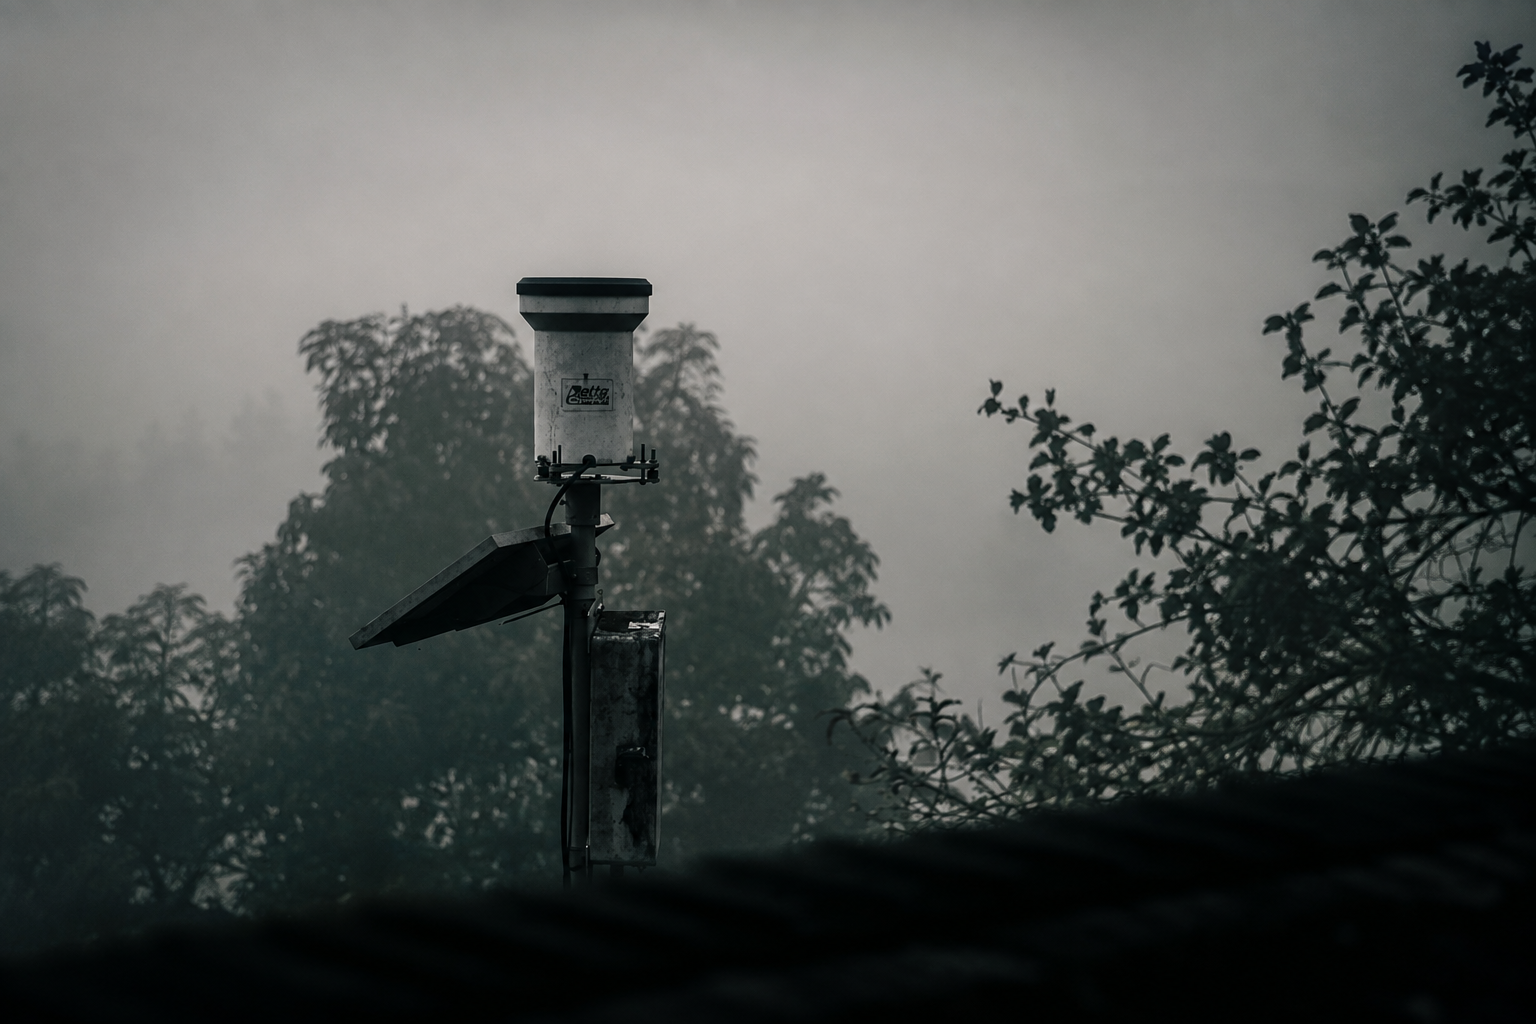
How Rain Gauge Data Loggers Work A rain gauge data logger captures precipitation by measuring the amount of water collected over time. The gauge itself typically consists of a funnel that directs rainfall into a graduated cylinder or a tipping bucket mechanism. When the bucket overflows, it triggers an electronic switch that records the event. The data logger then timestamps each reading, allowing you to see not only total rainfall but also the intensity and frequency of rain events.
The core of the system is the microcontroller, which processes sensor signals and stores them in non‑volatile memory. Most loggers use a simple analog‑to‑digital conversion to read the level sensor, then apply a calibration curve to translate voltage into millimeters or inches. The device may also include a temperature sensor to adjust for evaporation or condensation effects, improving the accuracy of the recorded data.
Wireless connectivity is often built into modern loggers. By transmitting data via radio, cellular, or Wi‑Fi, you can retrieve real‑time information on your smartphone or computer. This feature eliminates the need to manually download files, making it easier to monitor rainfall trends as they happen. The logger’s firmware may also support automatic data compression, ensuring that large volumes of data do not overwhelm storage or bandwidth.
Choosing the Right Data Logger for Your Needs When selecting a data logger, consider the range of rainfall you expect to measure. Some devices are calibrated for light showers, while others handle heavy downpours without saturation. If you live in an area prone to flash flooding, a logger with a high maximum rate and quick response time will give you more reliable alerts.
Power supply is another critical factor. Battery‑powered loggers offer flexibility in remote locations but require periodic replacements or recharging. Solar‑powered units can operate indefinitely if positioned correctly, though they may need maintenance to keep panels clear of debris. Wired loggers, while less portable, provide a constant power source and can be integrated into larger monitoring networks.
Data resolution and storage capacity also shape your choice. A logger that records every minute may produce a large file that requires more memory, whereas a device that logs hourly data will conserve space but miss short‑term spikes. If you plan to perform detailed hydrological modeling, higher temporal resolution will be essential. Ensure the logger’s memory or cloud storage can accommodate the volume of data you anticipate generating over the year.
Installing and Maintaining Your Rain Gauge System Proper installation begins with selecting an ideal location. The gauge should sit on a flat, unobstructed surface, away from trees, buildings, or windbreaks that could interfere with rainfall capture. Elevating the gauge on a pole or tripod reduces the impact of surface runoff and wind drift. The funnel should be oriented to avoid shading, which can cause evaporation before the rain enters the sensor.
Once positioned, secure the gauge firmly to prevent movement during storms. A stable mount ensures that the tipping bucket or level sensor remains aligned and that the data logger’s antenna maintains a clear signal path. Attach a rain shield or cover to protect the electronics from rain and debris, but make sure it does not obstruct airflow or create condensation inside the unit.
Routine maintenance involves cleaning the funnel and sensor surfaces at least once a month, especially after heavy rainfall or when vegetation has grown nearby. Check the battery or solar panel for wear and replace or recharge as needed. Verify that the logger’s firmware is up to date, as updates may improve accuracy or add new features. Regularly backing up the data to a computer or cloud service safeguards against data loss.
Interpreting and Using Collected Data After you have gathered sufficient data, the next step is analysis. Plotting rainfall totals against time reveals patterns such as seasonal peaks, diurnal cycles, or anomalous events. By comparing your local measurements with regional weather reports, you can assess the precision of your logger and calibrate it if necessary.
The data can inform irrigation schedules, helping you water crops or lawns only when needed. Farmers and gardeners can reduce water waste by aligning irrigation with actual rainfall rather than relying on generic guidelines. In urban settings, municipalities can use the data to manage stormwater infrastructure, adjusting detention basin capacities or flood warning thresholds based on observed trends.
Long-term datasets also support climate research. By aggregating monthly totals over several years, you can calculate trends in precipitation intensity, frequency, and duration. These metrics aid in modeling future water availability, assessing flood risk, and informing policy decisions. When sharing data with researchers or stakeholders, include metadata such as sensor calibration, installation date, and any maintenance activities to ensure transparency and reproducibility. A rain gauge data logger can further simplify the process by automatically recording precipitation measurements over extended periods, providing consistent data for analysis and long-term monitoring.
By understanding how rain gauge data loggers operate, selecting the right model, installing them correctly, and interpreting the data effectively, you gain a powerful tool for managing water resources, protecting infrastructure, and advancing climate science.